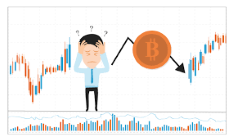
Bitcoin's price has suffered from extremely low volatility since a sharp fall in early November. We will discuss how to read Bitcoin Charts and the factors influencing the price of Bitcoin in this essay, "Bitcoin Analysis: How To Read Bitcoin Charts?"
Bitcoin Analysis: How To Read Bitcoin Charts?
Japanese candlesticks are typically used in Bitcoin charts to show price movement. Depending on the chart, each candle represents a particular time period and displays the open, close, and price range for that period. Additionally, the chart typically includes a number of technical analyses. indicators. Support and resistance levels, trendlines, the Relative Strength Index (RSI), and Fibonacci retraction levels are the most widely used indicators.
What affects the price of Bitcoin?
The price of Bitcoin is influenced by supply and demand, much like the price of any other traded asset. But the occurrence of specific worldwide events might be related to the price of bitcoin: For instance, the demonetization of Indian banknotes in 2016 had a positive effect on Bitcoin. The price of cryptocurrency was 20% greater in India than it was everywhere else. If we look at former years, Facebook's announcement of the Libra project may be connected to the 2019 bull run. As word about the difficulty of Libra's regulation began to circulate, the bull-run started to lose steam. In addition to the significant worldwide events, there are several Bitcoin heavy-bag owners, also referred to as Bitcoin Whales.
We hope you get a better understanding after reading this article, "Bitcoin Analysis: How To Read Bitcoin Charts?"