As long as trades exist, trading indicators have been developed as a useful tool to help traders make informed predictions about their positions. So what are best crypto trading indicators and Controlling Risk with Crypto Indicators? If you do not know yet, let’s read the article below.
What are crypto trading indicators?
A trading indicator is a technical tool that uses charts and mathematical formulas to indicate market direction. Crypto traders or investors use indicators in conjunction with trading charts to analyze market conditions. The basic idea is to study past market movements and then use them to predict future price trends and patterns. While indicators should indicate where the market is headed, it is important to mention that they do not predict the price of Bitcoin or other crypto assets with absolute certainty. The overall goal is to help you identify trading opportunities to maximize profits while minimizing losses.
What are the best crypto trading indicators?
- Simple Moving Averages (MA)
- Moving Average Convergence/Divergence (MACD)
- On-Balance Volume (OBV)
- Relative Strength Index (RSI)
- Bollinger Bands
Controlling Risk with Crypto Indicators
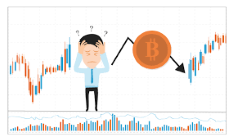
The magic of crypto indicators is that they can help us better understand where the market is currently and where it might be headed. Indicators allow you to visualize market data and apply mathematical formulas that calculate support and resistance levels. But since people trade financial markets, not robots, those price levels are not always respected. This means that you cannot rely solely on metrics and expect their results to be 100% accurate.
Indicators are represented here. Oversold RSI levels indicate that the asset may have bottomed. However, it is impossible to tell if a bottom has been formed or if the price will collapse again. If you're after accuracy, I recommend combining indicators, price data, and market models to find confluences.
Confluence is a cryptographic term used to describe a bullish or bearish market direction supported by two or more factors. Suppose I want to buy spot bitcoin at a safe support level. The Fibonacci tool tells me that Bitcoin should find support at $19,000. However, a single indicator should decide whether I'm buying or selling. So I added the RSI indicator and found that Bitcoin is just a few pips away from entering an oversold state of 30 RSI. Now I have two indicators telling me that the bottom is here and I should buy.
The above scenario is an example of fusion. Finding the 200-week MA right at $19,000 would also help with the confluence and make my situation clearer. The more indicators there is a consensus on where the market is going next, the better my chances of a successful trade. Therefore, if you want to control your risk when trading with crypto indicators, you should always look for confluence points.
I hope this article will help you to learn what are best crypto trading indicators and Controlling Risk with Crypto Indicators. The overall goal of using crypto trading indicators is to help you interpret market conditions to identify trading opportunities.