When the price declines to new lows but the indicator does not, signaling something different, this is known as a bullish divergence pattern. Let's explore more.
What is the Bullish Divergence Candlestick Pattern?
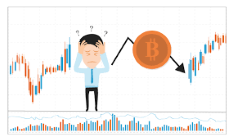
Technical analysis and trading in general both include a divergence, which is quite an unusual phenomenon. The market price of a particular item and an oscillator or momentum indicator, like the RSI or the MACD, are essentially in "disagreement."
Traders who notice this divergence phenomenon use it as a leading signal to purchase or sell an asset until the market price and the indicator are fully correlated once more.
The divergence pattern comes in both bullish and bearish variations, just like many other chart patterns.
When the price declines to new lows but the indicator does not, signaling something different, this is known as a bullish divergence pattern. The bullish divergence typically denotes a market price correction or a reversal of the uptrend.
Despite being among the most challenging patterns in technical analysis, it is also a very beneficial pattern that provides traders with a tonne of trading possibilities. Most importantly, you'll probably run across this circumstance rather frequently because it's a pattern ore natural events.
Pros and Cons of the Bullish Divergence Candlestick Pattern
The most typical benefits and drawbacks of trading the bullish divergence pattern are listed below:
Pros
- A very trustworthy indicator
- Provides a wealth of trading chances, especially for short-term traders
Cons
- Difficult to recognize and identify on trade charts.
- Not a reliable sign. It serves as an additional confirmation to enter or quit a position instead.
- Not ideal for beginner traders
"What is the Bullish Divergence Candlestick Pattern? And Pros And Cons of It," I hope this article can help you to understand it better.